When Diversification Fails: Stocks −18%, Bonds −13% in the Same Year
By Daniel Kim
TLDR
In 2022, the S&P 500 lost 18.1% and the Bloomberg U.S. Aggregate Bond Index lost 13.0% — the bond index's worst calendar year since it began in 1976. A classic 60/40 portfolio fell about 16.9%, only about one percentage point better than holding stocks alone. The cause was inflation: the Federal Reserve raised rates 425 basis points in nine months, and bond prices fall when rates rise. Diversification is not dead — but diversification built only on stocks and bonds fails exactly when inflation drives a selloff. This post shows the numbers, explains why the hedge broke, and gives you four checks to run on your own portfolio this week.
The promise that broke
Every investor has heard the rule: stocks zig, bonds zag. When stocks fall, bonds are supposed to catch you. For most of the last forty years, that rule worked. In 2008, when the S&P 500 lost 37.0%, bonds gained 5.2% — the cushion did its job, and balanced portfolios lost about 20% instead of 37%.
Then came 2022, and the rule broke in public.
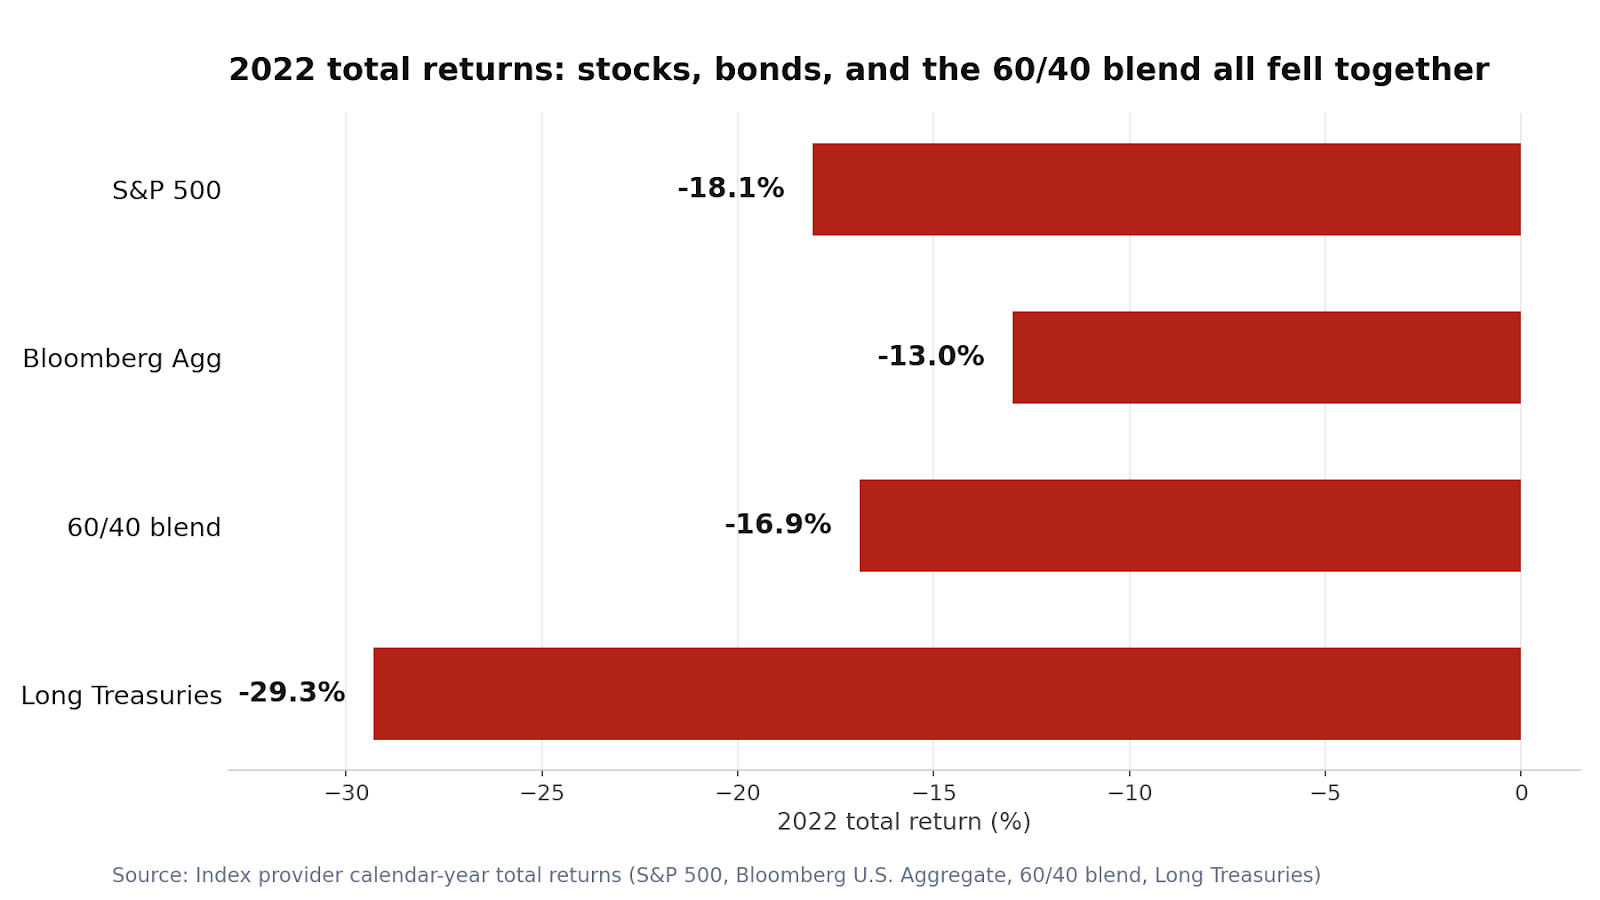
That year, U.S. stocks fell 18.1% on a total-return basis. U.S. bonds fell 13.0%. Long-term Treasuries fell 29.3% — the worst year on record for some bond benchmarks. A 60/40 portfolio, the default setting in millions of 401(k) accounts, lost about 16.9%. Put $10,000 into a classic 60/40 on January 1, 2022, and you ended the year with about $8,310.
That is not a footnote. It is the year the most common portfolio in America discovered that its safety net was tied to the same rope as the thing it was supposed to catch.
What actually happened in 2022
The numbers are stark enough to state plainly first, then explain.
| Asset | 2022 total return |
|---|---|
| S&P 500 (U.S. stocks) | −18.1% |
| Bloomberg U.S. Aggregate Bond Index | −13.0% |
| Bloomberg U.S. Long Treasury Index | −29.3% |
| Classic 60/40 blend (60% stocks, 40% bonds) | −16.9% |
Those are calendar-year total returns, dividends and interest included. The bond index's −13.0% was its worst year since the index began in 1976. It was also the first time in more than 30 years that U.S. stocks and U.S. bonds both finished a calendar year down.
The damage inside the year was worse than the year-end numbers suggest. From its January 3 close of 4,796.56, the S&P 500 fell 25.4% to 3,577.03 on October 12. The 60/40 blend fell about 20.1% from its December 2021 peak to its September 2022 low. It took until February 2024 — roughly 26 months — for the 60/40 portfolio to climb back to its old peak.
Behind the market moves sat a single driver: inflation, and the Federal Reserve's response to it. Consumer prices rose 9.1% year over year in June 2022, the fastest pace in about forty years, and were still running at 6.45% in December. The Fed answered with the fastest hiking cycle since Paul Volcker's disinflation of the early 1980s: seven hikes in nine months, 425 basis points in total, taking the federal funds rate from 0–0.25% to 4.25–4.50%. Four of those hikes were 75 basis points each — June, July, September, and November — a move size the Fed had not used since 1994.
Why your "safe" bonds fell too
Three mechanisms turned bonds from cushion into casualty. Understanding them is the whole point of this post, because each one points at a specific check you can run today.
1. The selloff was inflation-driven, not growth-driven. Bonds protect you when the economy weakens and the Fed cuts rates — falling rates push bond prices up, which is what happened in 2008 and again in 2020. But in 2022 the economy was not collapsing; prices were surging. The Fed was raising rates, not cutting them. When rates rise, bond prices fall. It is arithmetic, not opinion: the yield on the Aggregate index rose from 1.03% in August 2020 to 4.68% by the end of 2022, and that climb is what produced the −13.0% return. If you want to know whether your bonds will protect you in the next selloff, ask what is causing the selloff. If the answer is inflation and rate hikes, history says the bond hedge is the thing at risk. For the Fed's side of that story — how rate decisions ripple into everyday borrowing costs — see our earlier explainer on what the Fed's rate warning means for your money.
2. Duration was the amplifier. Not all bonds fell equally. The broad Aggregate index fell 13.0%; long-term Treasuries fell 29.3% — more than the stock market. The difference is duration: the longer a bond's maturity, the harder its price falls when rates rise. Many investors who thought they owned "safe" bonds actually owned long-duration bond funds, and duration is what turned a bad year into a brutal one. The 10-year Treasury yield is the number to watch here — we track it in why the 10-year Treasury yield moves your wallet.
3. The correlation flipped. For years, stocks and bonds moved in opposite directions — when one fell, the other tended to rise. The rolling three-year correlation between stocks and long Treasuries flipped from about −0.42 in 2020 to +0.52 in 2022. In plain English: the two assets started falling together, at the exact moment investors needed them to diverge. That flip is not a law of nature — correlations were positive in the 1990s too, around +0.5 — but it is a reminder that the negative correlation of the 2010s was a phase, not a guarantee.
The 60/40 scorecard: 2022 vs. 2008
The fairest way to judge 2022 is to put it next to the last crisis everyone remembers.
| 2008 (financial crisis) | 2022 (inflation shock) | |
|---|---|---|
| S&P 500 total return | −37.0% | −18.1% |
| Bloomberg Aggregate total return | +5.2% | −13.0% |
| 60/40 blend (start-of-year weights) | ≈ −20.1% | −16.9% |
| What drove the selloff | Deflation fear, Fed cutting rates | Inflation, Fed hiking rates |
| How much did bonds cushion? | About 17 points (vs. all stocks) | About 1 point (vs. all stocks) |
Two things stand out. First, 2022 was not the worst year for a balanced portfolio in absolute terms — the 2008 blend lost more. Second, and more important, 2022 was the worst year for what bonds are for. In 2008, adding bonds to stocks saved you about 17 percentage points. In 2022, adding bonds saved you about one. The hedge did not just weaken; for practical purposes, it stopped existing for that year.
The recovery tells the rest of the story. The 60/40 blend regained its December 2021 peak in February 2024, about 26 months after the top. Staying invested worked — but only for investors who could stomach a 20% drawdown without selling at the bottom, and only because the inflation shock eventually faded. The bond sleeve itself took far longer: the Aggregate index only briefly recovered its 2021 level in early 2026, meaning bonds delivered close to nothing for about five years.
Four checks to run on your portfolio this week
The lesson of 2022 is not "sell your bonds." It is "know what your bonds actually do, and what they do not do." Run these four checks — they take less than an hour combined, and each one maps directly to a 2022 failure.
Check 1: What is your bond duration? Open your bond fund's fact sheet and find its average duration. Long-duration funds (10+ years) are the ones that lost nearly 30% in 2022. If your time horizon is under ten years, or if you cannot tolerate a double-digit bond loss, a shorter-duration fund is the direct fix. This is the single highest-leverage check on this list.
Check 2: Do you own anything that rises with inflation? In 2022, the assets that held up were the ones tied to inflation itself, not to interest rates. Series I savings bonds are the simplest example for U.S. savers: their rate adjusts with inflation, and our guide to I Bonds at 4.26% — and the 3 mistakes that could cost you walks through the purchase limits and the timing traps. Treasury Inflation-Protected Securities (TIPS) and short-term cash equivalents play the same role at portfolio scale — cash yields rose with the Fed in 2022, from near zero toward 4% and higher by year-end, while long bonds were falling.
Check 3: Is your cash buffer real? The investors who sold at the bottom in 2022 mostly sold because they needed money, not because they changed their minds. An emergency fund worth three to six months of expenses is what lets you hold a 60/40 portfolio through a 20% drawdown instead of locking the loss in. If you do not have one, building it comes before optimizing your allocation — our step-by-step how to build an emergency fund covers the order of operations.
Check 4: Is your rebalancing on a schedule, not on fear? The 60/40 portfolio recovered by February 2024. Investors who rebalanced on a calendar — selling a little of what had held up, buying a little of what had fallen — bought stocks near the lows. Investors who waited for "things to feel safe" bought back higher. Pick a date, twice a year, and rebalance then. Write it down. That written rule is worth more than any market forecast.

Scenario: if inflation comes back
SCENARIO — not a prediction. Suppose consumer prices re-accelerate above 4% while the Federal Reserve is raising rates again. In that scenario, the 2022 pattern could repeat: stocks and bonds falling together, the 60/40 blend offering little cushion, and long-duration bonds falling the most. The point of the four checks above is to have them done before that scenario, not during it. If inflation stays near target and the Fed is cutting, the old pattern — bonds cushioning stocks — is the more likely one. Either way, the checks cost nothing and the answers are the same.
The line to remember
Diversification is not owning two things that fall on different days. It is owning things that fall for different reasons. In 2022, stocks and bonds fell for the same reason — and that is why the hedge failed.
FAQ
Is the 60/40 portfolio dead?
No. It lost about 16.9% in 2022, then recovered its prior peak by February 2024. The lesson is narrower and more useful: a portfolio of only stocks and bonds has a known weak spot — inflation-driven selloffs. The fix is to add inflation-aware diversifiers (short-duration bonds, TIPS, I Bonds, cash) and to know your duration, not to abandon the 60/40 entirely.
Why did bonds fall at the same time as stocks in 2022?
Because the Fed raised rates 425 basis points in nine months to fight 9.1% inflation. Bond prices fall when yields rise, so the rate hikes that were meant to cool inflation directly pushed bond prices down. In 2008 the Fed was cutting rates, which pushed bond prices up — same mechanism, opposite direction.
What actually held up in 2022?
Short-term cash equivalents and inflation-linked bonds. As the Fed hiked, money-market and Treasury-bill yields climbed from near zero toward 4% and higher by year-end, while long-term bonds fell 29.3%. Series I Bonds, whose rate tracks inflation, were the simplest inflation hedge available to individual savers.
Should I sell my bonds now?
There is no blanket answer, and this article is educational, not personalized financial advice. The right question is narrower: what is your bond duration, and does it match your time horizon? Selling long-duration bonds after they have already fallen locks in the loss. For most long-term investors, the better move is the one in Check 1 — know your duration, shorten it if it does not match your horizon, and rebalance on a schedule.
Sources
- S&P 500 total return 2022 (−18.11%) and Bloomberg U.S. Aggregate total return 2022 (−13.01%): FactSet/Bloomberg data via Alameda Health System plan document — alamedahealthsystem.org
- 60/40 blend −16.9% in 2022 (start-of-year weights), S&P 500 peak-to-trough −25.4%: Swoopr Investment, "2022 Rate Shock" — getswoopr.com
- 2022 returns summary (S&P 500 about −18%, Aggregate about −13%, worst Aggregate year since 1976): Singh PWM — singhpwm.com
- Fed 2022 hiking cycle — 7 hikes, 425 basis points, 0–0.25% to 4.25–4.50%: Pomegra — pomegra.io
- CPI peak 9.1% in June 2022, 6.45% by December; Fed hike timeline: TheStreet — thestreet.com
- Long Treasuries −29.3% in 2022; stock–bond correlation flip: Jones Fiduciary Wealth Management, "The Bond Myth" — jonesfwm.com
- Correlation −0.42 (2020) to +0.52 (2022), Bloomberg data: Voronoi — voronoiapp.com
- 2008 comparison — S&P 500 −37.0%, Bloomberg Aggregate +5.2%: Open Funds research paper — open-funds.ch
- 60/40 drawdown −20.1% and recovery to prior peak February 2024: Bondfish analysis — bondfish.com
Comments
Post a Comment