The 10-Year Treasury Is at 5.09% — Why Your Mortgage Rate Is Still 7.40%
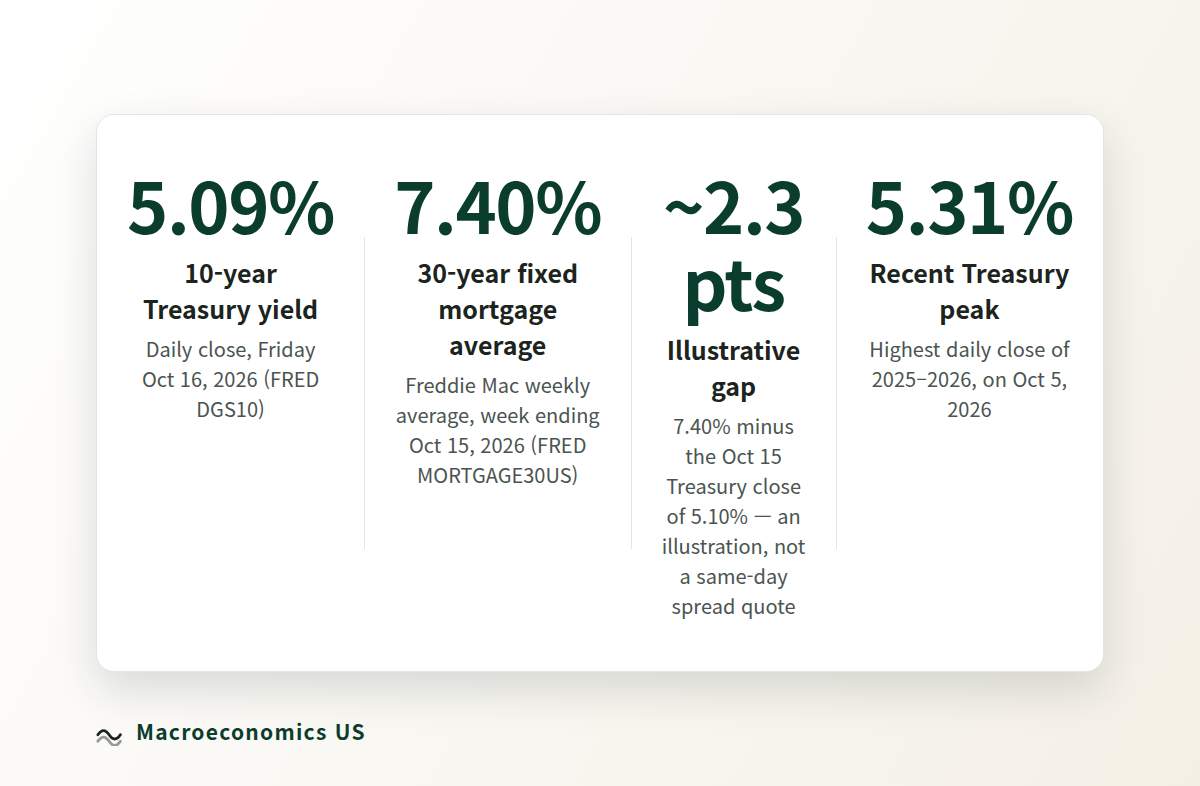
The 10-year Treasury yield closed at 5.09% on Friday, Oct 16, 2026, while Freddie Mac's average 30-year fixed mortgage rate was 7.40% for the week ending Oct 15. A Treasury near 5% does not mean a mortgage near 5%, and the two readings are not even the same kind of number: one is a daily close, the other a weekly average. The roughly 2.3 percentage-point gap between them (7.40% minus the Oct 15 close of 5.10%) is an illustration, not a precise spread quote, and the rest of this post explains what sits inside that gap and what it does to the monthly payment on a new loan.

| Reading | Value | Date and frequency |
|---|---|---|
| 10-year Treasury yield (DGS10) | 5.09% | Daily close, Fri Oct 16, 2026 |
| 30-year fixed mortgage rate, Freddie Mac average (MORTGAGE30US) | 7.40% | Weekly, week ending Oct 15, 2026 |
| Illustrative gap: 7.40% minus 5.10% (Oct 15 close) | About 2.3 percentage points | Illustration only, not a same-day spread |

Source: FRED DGS10 and FRED MORTGAGE30US.
What the 10-Year Treasury Yield Actually Is
The 10-year Treasury yield is a market benchmark. It is the return investors accept for lending to the U.S. government for ten years, and it changes every trading day as those investors buy and sell. Think of it as a reference point that other rates get compared with. It is not a loan offer, and it is not a rate you can apply for.
That distinction is where the assumption that a 5% Treasury means a 5% mortgage breaks down. A headline that says yields hit 5% describes the market yield on a government security. A lender quoting you a mortgage is pricing a different product: a loan you can repay early, that someone has to service, and that investors hold in pools alongside many other loans. The two series also run on different clocks: DGS10 is a daily close, while MORTGAGE30US, Freddie Mac's 30-year fixed average on FRED, is a weekly reading. That is why this post treats the gap as an illustration.
The Impact Chain: From a Treasury Move to Your Monthly Payment
Here is the transmission path from a Treasury move to a new loan's payment. Interpretation is labeled as such.
- Treasury yields move (FRED data). The 10-year first closed at or above 5.00% in 2026 on Sep 15, hit a recent peak of 5.31% on Oct 5, and closed at 5.09% on Oct 16.
- MBS pricing responds (interpretation). Fixed mortgages are priced off mortgage-backed securities (MBS) traded in capital markets. My read: when Treasury yields rise, MBS investors tend to ask for more yield too, and lenders who sell loans into that market could need to quote higher rates to match. This post uses no MBS price or yield series, so this link is described, not measured.
- Lender quotes follow (FRED data, interpreted link). Freddie Mac's weekly average 30-year fixed rate was 6.76% for the week ending Sep 10 and 7.40% for the week ending Oct 15, up 0.64 percentage points (7.40 minus 6.76). My read: the direction fits the chain, since every 2026 Treasury close before Sep 15 was below 5.00% and the Oct 15 close was 5.10%. The exact Treasury close for Sep 10 is not part of this data, so the two moves are not compared point for point, and no one-for-one relationship is claimed.
- The monthly payment on a new loan changes (hypothetical dollars). On a $400,000, 30-year fixed loan, principal and interest at 6.50% is $2,528 per month and at 7.50% is $2,797, a difference of $269 per month. Those two rates are hypothetical, not market quotes.
Each arrow in that chain is a relationship, not a formula.
Why Mortgages Price Above Treasuries
No single factor explains the whole gap, and this post does not split the roughly 2.3 points into shares because no verified breakdown is part of the data used here. Four pieces are in play.
1. Pricing off mortgage-backed securities. A fixed-rate mortgage is not priced as a copy of a Treasury. It is priced off the market for mortgage-backed securities, which are pools of home loans sold to investors. That market has its own supply and demand, which could be one reason there is no fixed one-for-one link between the 10-year yield and mortgage rates.
2. Prepayment risk. A borrower can repay a mortgage early, by selling the home or refinancing, and the investors holding the loan pool then get principal back sooner than planned. Investors price that uncertainty into the yield they require. A refundable airline ticket costs more than a nonrefundable one because the buyer keeps the right to walk away. A mortgage the borrower can repay at any time carries a similar kind of premium.
3. Guarantee and servicing costs. Someone stands behind the loan's payments to the investors who hold it, and someone collects those payments, keeps the records and handles accounts that fall behind. Those functions cost money, and the gap between the Treasury yield and the mortgage rate helps cover them.
4. Lender margin. The lender that originates the loan adds a margin to cover its own operating costs and profit. This is a piece that could differ from one lender to the next, so two quotes on the same day might not match.
My read: watching only the 10-year yield gives a partial picture of what a mortgage costs, because the prepayment premium, the guarantee and servicing costs and the lender's margin all sit in the gap and do not show up in the Treasury yield itself.
Reader Math: What One Percentage Point of Rate Does to a Payment
The rates below are hypothetical, not market quotes. They are chosen to show scale and are not the 7.40% Freddie Mac average or any lender's offer. The loan is $400,000 over 30 years at a fixed rate, principal and interest only.
| Hypothetical scenario | Rate | Monthly payment (principal and interest) |
|---|---|---|
| $400,000 loan, 30-year fixed | 6.50% | $2,528 |
| $400,000 loan, 30-year fixed | 7.50% | $2,797 |
| Difference | 1.00 percentage point | $269 per month, about $3,223 per year |
Taxes, insurance, points and closing costs are excluded. The yearly figure is calculated from the unrounded monthly payments, so multiplying the rounded $269 by 12 lands a few dollars higher.
The universal formula. Monthly payment = P × r ÷ (1 - (1 + r)^-n), where P is the loan amount, r is the annual rate divided by 12 as a decimal (for 6.50%, r is 0.065 divided by 12), and n is the number of monthly payments (360 for a 30-year loan). In a spreadsheet: =PMT(annual_rate/12, 360, -loan_amount).
Percent math versus dollar math. Percent math sizes the gap on paper: the roughly 2.3-point gap between the two headline numbers is a difference between two rates, measured in percentage points, not a percentage markup on either rate. Dollar math sizes it in a budget: one percentage point between those two hypothetical rates is $269 per month on this loan. The dollar effect of one percentage point is not identical at every rate level, so treat the table as a scale marker, not a constant.
To size one percentage point on your own loan, run the formula at your quoted rate and at a rate 1.00 percentage point lower; the difference is the monthly cost of that point. Payments scale in direct proportion to the loan amount at the same rate, so divide your loan by $400,000 and multiply the table's payments by that ratio for a quick comparison.
Who Is Actually Affected
New buyers and refinance applicants. These are the borrowers whose payments are set by current quotes. A new loan or a refinance is priced when it is made, so the chain above applies to them. For this group, the 7.40% weekly average could serve as a starting point, though an individual quote can differ from an average.
Existing fixed-rate borrowers. They keep their contractual payment when yields rise. The principal and interest on a fixed loan that is already signed does not change because the 10-year yield moved.
HELOCs, auto loans and credit cards. HELOCs are usually tied to short-term benchmarks, not the 10-year yield. Auto loans and credit cards are priced on their own terms as well, so a move in the 10-year is not a direct read on those rates.
Trend Context: One Day's Close Is Not the Story
The quarterly average of the 10-year yield (FRED DGS10) was 4.26% in Q3 2025, 4.10% in Q4 2025, 4.20% in Q1 2026, 4.42% in Q2 2026 and 4.76% in Q3 2026. After the dip in Q4 2025, the average rose in each of the next three quarters.

Daily closes add detail, but they do not turn one day into a trend. The first close at or above 5.00% in 2026 came on Sep 15. The recent peak was 5.31% on Oct 5, and the 10-year closed at 5.10% on Oct 15 and 5.09% on Oct 16, which is 0.22 percentage points below the peak (5.31 minus 5.09). Across 2025 and 2026, daily closes ranged from a low of 3.97% (Oct 22, 2025) to a high of 5.31% (Oct 5, 2026). My read: that puts 5.09% in the upper part of the 2025 to 2026 range.
On the mortgage side, Freddie Mac's weekly average read 6.76% for the week ending Sep 10, then 7.40% for the week ending Oct 15 and for the week before it. My read: a flat two-week mortgage reading and a 0.22-point Treasury pullback are thin evidence of direction, and the multi-quarter rise in the average is the steadier backdrop for a household decision. None of these readings is a forecast.
The headline rate is only one line of what a mortgage costs. Save this list and compare APR, points, fees and lock period, not just the headline rate.
FAQ
### Does a 5% Treasury mean a 5% mortgage?
No. On the readings used here, the 10-year closed at 5.09% on Oct 16 while Freddie Mac's weekly average 30-year fixed rate was 7.40% for the week ending Oct 15. There is no fixed one-for-one link between the 10-year yield and mortgage rates. Fixed mortgages are priced off mortgage-backed securities, and the gap covers prepayment risk, guarantee and servicing costs, and lender margins. The roughly 2.3-point gap is an illustration built from a daily close and a weekly average, not a precise spread.
### Will my existing fixed payment rise?
No, not because Treasury yields rose. Existing fixed-rate borrowers keep their contractual payment when yields rise. The chain described above reprices new loans, meaning purchases and refinances. A HELOC is a separate product and is usually tied to a short-term benchmark rather than the 10-year, so it follows a different clock.
### Should I wait to buy until yields fall?
This post does not forecast yields, and one close cannot show direction. The data shows that the quarterly average rose in each of the last three quarters, reaching 4.76% in Q3 2026, and that the Oct 16 close of 5.09% sat 0.22 percentage points under the Oct 5 peak of 5.31%. Neither fact says what comes next. A budget test is more useful than a guess: run the payment formula at your quoted rate and at a rate one percentage point lower. If the payment fits your budget at the quoted rate, the decision could come down to your timeline and savings. If it only fits at the lower rate, the plan depends on a rate move that cannot be promised. This is general information, not personalized financial advice.
One Line to Keep
- Treat the 10-year yield as background, not as your rate, and note the date and frequency of every rate you compare (daily close, weekly average or lender quote).
- Compare the APR as well as the headline rate. APR reflects some of the borrowing costs, so it can sit above the headline rate.
- Ask whether the quote includes points, which are upfront payments that can change the rate, and what they buy.
- Ask for the itemized fees and closing costs. The payment table above excludes them.
- Ask for the lock period, meaning how long the quoted rate is held, and what happens if closing runs past it.
- Run the payment formula on your own loan amount at the quoted rate, then add taxes and insurance.
A Treasury yield tells you where a market is trading; a mortgage quote tells you what you would pay. Next action: take your latest quote, write down its date, and run the payment formula at that rate on your own loan amount.
Sources and Data Notes
- FRED series DGS10: 10-year Treasury yield, daily. Source of every Treasury figure in this post, including the quarterly averages.
- FRED series MORTGAGE30US: Freddie Mac 30-year fixed average, weekly. Source of the 7.40% and 6.76% readings.
- Data as of Oct 16, 2026 (Treasury close) and the week ending Oct 15, 2026 (mortgage average), extracted Oct 20, 2026. The 6.50% and 7.50% rates are hypothetical.

Comments
Post a Comment