The Fed Decides Before the October Data Arrives: What the October 27-28 FOMC Meeting Could — and Could Not — Know
The Federal Open Market Committee (FOMC) meets October 27-28, 2026, after the Bureau of Labor Statistics (BLS) published September's employment report (October 2) and Consumer Price Index (CPI) report (October 14), and before the October versions of both, which are scheduled for November 6 and November 10. If you read those November numbers as if they were on the table at the meeting, you could misjudge what had been published when the Committee met. This article gives you a dated map of what was on the record before the meeting and what was not.
*Baselines: employment figures as of the BLS release of October 2, 2026; CPI figures as of the BLS release of October 14, 2026; meeting dates as of the Federal Reserve calendar last updated October 7, 2026. This article is about data timing. It forecasts no decision and contains no October figures.*
1. The Meeting Sits Between Two Data Releases

Five dates frame this article. The first two are reports that are already published. The last two are scheduled after the meeting.
| Date | What happens | Reference month | Relative to the meeting |
|---|---|---|---|
| October 2, 2026 | BLS publishes the employment report: nonfarm payrolls and unemployment rate | September 2026 | Published before the meeting |
| October 14, 2026 | BLS publishes the CPI report | September 2026 | Published before the meeting |
| October 27-28, 2026 | FOMC meeting | Not applicable | The meeting |
| November 6, 2026 | BLS employment report (scheduled) | October 2026 | AFTER THE MEETING |
| November 10, 2026 | BLS CPI report (scheduled) | October 2026 | AFTER THE MEETING |
One distinction carries the rest of the article. The November 6 and November 10 reports concern October activity, yet they are scheduled for publication after the meeting. "October data" names the period a report describes. It does not tell you when anyone could read it.
Sources: Federal Reserve FOMC meeting calendar (last updated October 7, 2026) for the meeting dates; BLS Employment Situation and BLS Consumer Price Index for the reports. Scheduled dates can change, so confirm them on the BLS site before you rely on them.
2. The Starting Point: What Was Already on the Record?
These are the published figures that exist before the meeting. Each carries its reference month and the day it was published. The policy range sits in its own table because it is a policy setting, not a statistic.
| Statistic | Value | Reference month | Published |
|---|---|---|---|
| Nonfarm payroll growth | +29,000 | September 2026 | October 2, 2026 |
| Unemployment rate | 4.2% | September 2026 | October 2, 2026 |
| Statistic | Value | Reference month | Published |
|---|---|---|---|
| CPI, year over year | +3.7% | September 2026 | October 14, 2026 |
| CPI, month over month | +0.6% | September 2026 | October 14, 2026 |
| Gasoline prices, month over month | +9.1% | September 2026 | October 14, 2026 |
| Gasoline's share of the monthly CPI increase | More than half | September 2026 | October 14, 2026 |
| Item | Value | Note |
|---|---|---|
| Federal funds target range going into the meeting | 3.75%-4.00% | The most recent decision covered in this article was made September 16, 2026 and took effect September 17, 2026. |
The October employment and CPI figures are absent from these tables because those two reports are scheduled after the meeting.
3. September's Inflation Number Has More Than One Layer
One CPI report contains three layers: the headline, a component's own price change, and that component's contribution to the headline. The table keeps them apart.
| Layer and number | What it says | What the number alone does not say |
|---|---|---|
| Headline: CPI +3.7% year over year | The overall change against a year earlier | How much of that change happened in September |
| Headline: CPI +0.6% month over month | The overall change from the prior month | Which categories produced the change |
| Component: gasoline +9.1% month over month | The change in gasoline's own price | How much gasoline added to the overall index |
| Contribution: gasoline accounted for more than half of the monthly CPI increase | Gasoline's share of the overall monthly increase | How any other category moved. A large gasoline contribution does not establish that every other category moved the same way. |
Three different numbers answer three different questions: gasoline's own price change was 9.1%, the whole index's monthly change was 0.6%, and more than half of that 0.6% came from gasoline. The figures listed here describe gasoline and the headline only. They do not describe any other category, and this article makes no claim about them. For component detail, read the official BLS Consumer Price Index release.
Reader math. Rule-of-thumb, not a forecast: a component's contribution to the headline is roughly its share of the index times its own price change. The two views below give the same answer with different intuition.
| View | Formula | What it shows |
|---|---|---|
| Percent math | Contribution (percentage points) ≈ w × g | A component's contribution depends on its share of the index, not only on how far its own price moved. |
| Dollar math | Added dollars ≈ S × (g ÷ 100). Contribution (percentage points) ≈ (added dollars ÷ B) × 100 | The same result, seen as added cost set against the whole basket. |
Here w is gasoline's share of the index written as a decimal (the percent share divided by 100), g is gasoline's percent price change, S is the dollars spent on gasoline in the basket, and B is the total dollars in the basket. Because w equals S divided by B, the two views agree.
My read: a headline figure is where you start, and the component detail is where you find what produced it.
4. September Employment: One Report, Two Different Indicators
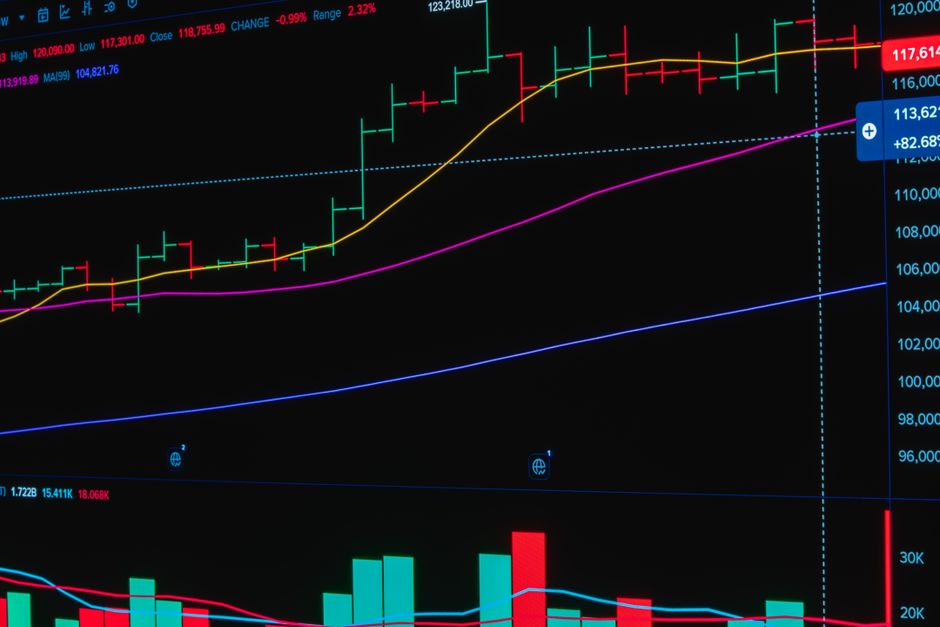
The October 2 report gave you two numbers for September 2026: nonfarm payroll growth of +29,000 and an unemployment rate of 4.2%. They arrived in one report on one date, yet they are different indicators. Payroll growth is a change in a count of jobs. The unemployment rate is a level written as a percentage. Each answers its own question, so read them one at a time.
| Indicator | Observation (a published statistic) | Interpretation (not a statistic) |
|---|---|---|
| Nonfarm payroll growth | +29,000 for September 2026, published October 2, 2026 | Any adjective or conclusion attached to the number. This article cites no comparison benchmark for it, so it reports the number as published. |
| Unemployment rate | 4.2% for September 2026, published October 2, 2026 | Any statement about what the rate implies for the economy or for policy |
| Both together | Two indicators in one report on one date | A single story that merges them. It would be your reading of two separate numbers, not a third statistic. |
The next employment report is scheduled for November 6, 2026. It covers October and arrives after the meeting.
My read: if you want to describe +29,000 with an adjective, name the comparison you are using before you write the adjective.
5. The Information Boundary: October 28 vs November 6 and November 10
Use one test before you use any number: compare a report's publication date with the meeting dates. Do not compare its reference month with the meeting month.
| Question | Was the report available by the meeting's last day? |
|---|---|
| Rule | Yes, if its publication date is on or before that day. The reference month does not enter the test. |
| This meeting | Last day: October 28, 2026. September employment report (published October 2): yes. September CPI report (published October 14): yes. October employment report (scheduled November 6): no. October CPI report (scheduled November 10): no. |
The matrix applies the test to the reports named in this article.
| Available* | Not Yet Released* |
|---|---|
| September employment report, published October 2, 2026: nonfarm payrolls +29,000; unemployment rate 4.2% | October employment report, scheduled November 6, 2026. AFTER THE MEETING |
| September CPI report, published October 14, 2026: CPI +3.7% year over year and +0.6% month over month; gasoline +9.1% month over month | October CPI report, scheduled November 10, 2026. AFTER THE MEETING |
* This matrix is not an exhaustive inventory of every information source available to policymakers. It lists only the reports named in this article.
Three things get mixed up at this boundary. Keep them separate:
- A published statistic. A figure released by its source in a dated report. Example: CPI +3.7% year over year, published by BLS on October 14, 2026.
- An interpretation of it. A reading someone attaches to the figure. Test: if a sentence tells you what a number means, it is an interpretation. If it only tells you what the number is, who published it and when, it is a statistic. An interpretation carries the date it was written, not the date of the data.
- A report not yet published. A scheduled release that has not been published. At this meeting, the October employment and CPI reports fall in this category.
6. The Policy Baseline

The policy record going into the meeting has three dated steps.
| Step 1 September 16, 2026 Decision: a 0.25-percentage-point increase, approved 12-0 |
→ | Step 2 September 17, 2026 Effective date of the increase |
→ | Step 3 October 27-28, 2026 The meeting. Target range going into it: 3.75%-4.00% |
Source for Steps 1 and 2: Federal Reserve statement and implementation note, as of September 16, 2026, listed on the Federal Reserve's monetary policy press releases page.
The September increase is a fact about September. It is not a precedent that tells you what the Committee will decide at the October 27-28 meeting, and this article does not forecast that decision. For the Committee's own wording on any date, use the press releases page rather than a summary of it.
7. What the Missing SEP and Dot Plot Do Not Tell You
No Summary of Economic Projections (SEP) or dot plot is scheduled for this meeting. When an SEP is issued, it compiles individual Committee participants' projections for variables such as economic growth, unemployment, inflation and the federal funds rate. The dot plot charts the rate projections.
| What this tells you | What this does not tell you |
|---|---|
| A scheduling fact: no SEP or dot plot is scheduled for this meeting. | A policy signal. The absence is not evidence for or against any policy action. |
| What an SEP would add when issued: individual participants' projections. | Whether any participant's projections have changed. Unpublished does not mean unchanged, and it does not mean changed. |
My read: a missing publication is a gap in the record, not a message.
8. November 6: How to Read the October Employment Report
The October employment report is scheduled for November 6, 2026, after the meeting. Its reference month is October 2026. This article does not predict what the report will show, and no figure in it carries an automatic policy meaning. When the report is out, work through the checklist below.
| Step | What to do | Reader math or rule |
|---|---|---|
| 1. New figures | Open the BLS Employment Situation release. Record the October nonfarm payroll change and the October unemployment rate exactly as published, with the reference month (October 2026) and the release date (November 6, 2026). | Copy the figures as published. Do not round them. |
| 2. Comparison with September | Set the September figures from the October 2 release (+29,000 and 4.2%) beside the October figures. If the November 6 release shows September figures as well, record those too and note any difference. | Payroll difference = October change minus 29,000. Unemployment-rate difference, in percentage points = October rate minus 4.2. |
| 3. What remains an interpretation | Anything beyond the numbers: adjectives, statements about the economy, and statements about what the Committee will or should do. Mark each as your own reading, with the date you wrote it. | Observation: copied from the release. Interpretation: written by you. |
9. November 10: How to Read the October CPI Report
The October CPI report is scheduled for November 10, 2026, after the meeting. Its reference month is October 2026. The table lists the September figures as published on October 14 and leaves the October column blank on purpose: those figures belong to a report published after the meeting, and this article uses none of them.
| Measure | September 2026 (published October 14, 2026) | October 2026 (scheduled November 10, 2026) |
|---|---|---|
| CPI, year over year | +3.7% | |
| CPI, month over month | +0.6% | |
| Gasoline prices, month over month | +9.1% | |
| Gasoline's contribution to the monthly CPI increase | More than half of the increase |
On November 10, work through these steps:
- Fill the October column only from the official BLS Consumer Price Index release.
- Compare like with like: year over year with year over year, month over month with month over month. The two measures cover different spans, so a monthly figure and a year-over-year figure are not interchangeable.
- Take component contributions, for gasoline and for any other category you follow, from the official release, for both September and October. This article lists only gasoline for September and makes no claim about other categories.
- Treat September's +9.1% gasoline figure as a comparison point, not a forecast of October's.
Reader math. Change in the year-over-year rate, in percentage points = October's year-over-year rate (in percent) minus 3.7. Change in the monthly rate, in percentage points = October's monthly rate (in percent) minus 0.6.
A comparison of October with September is a November 10 exercise. It does not describe what had been published by October 28.
10. Read the Next Reports Without Rewriting the Past
At the October 27-28 meeting, the published record included September's employment and CPI reports and the September 16 decision. The October employment and CPI reports describe October, but they are scheduled for November 6 and November 10, after the meeting. That boundary does not move when the new numbers arrive.
Later evidence can inform a retrospective analysis. It cannot become information that was published at the earlier meeting. Judging the meeting with the November reports is like judging a captain's route with a weather report issued after the ship left port.
Next action: date the report before you read the number. Write two dates beside every figure you quote about this meeting, the month it describes and the day it was published. Then run the figure through three questions:
- Was this report available by October 28?
- Am I reading the full indicator or only one headline component?
- Is this a verified observation or an interpretation?
*This article is about the timing of official data, not about your own accounts. If you want to connect any of it to your borrowing or saving, start with the terms in your own account documents; nothing here says whether, how or when any account is affected by a Committee decision.*
Comments
Post a Comment