The $1.993 Trillion Deficit: How the Federal Interest Bill Could Raise Your Next Loan Payment
You are holding a refinance quote, or you stopped at a monthly-payment calculator while shopping for a home, and the Congressional Budget Office (CBO) puts the federal deficit for fiscal year 2026 (FY2026) at $1.993 trillion in a preliminary estimate published October 8, 2026. My read: the deficit reaches your payment only indirectly, through interest rates, and the clearest evidence in CBO's report is the government's own interest bill, which came to $1.143 trillion. Below, those figures become arithmetic you can rerun with your own loan terms.

What CBO actually reported
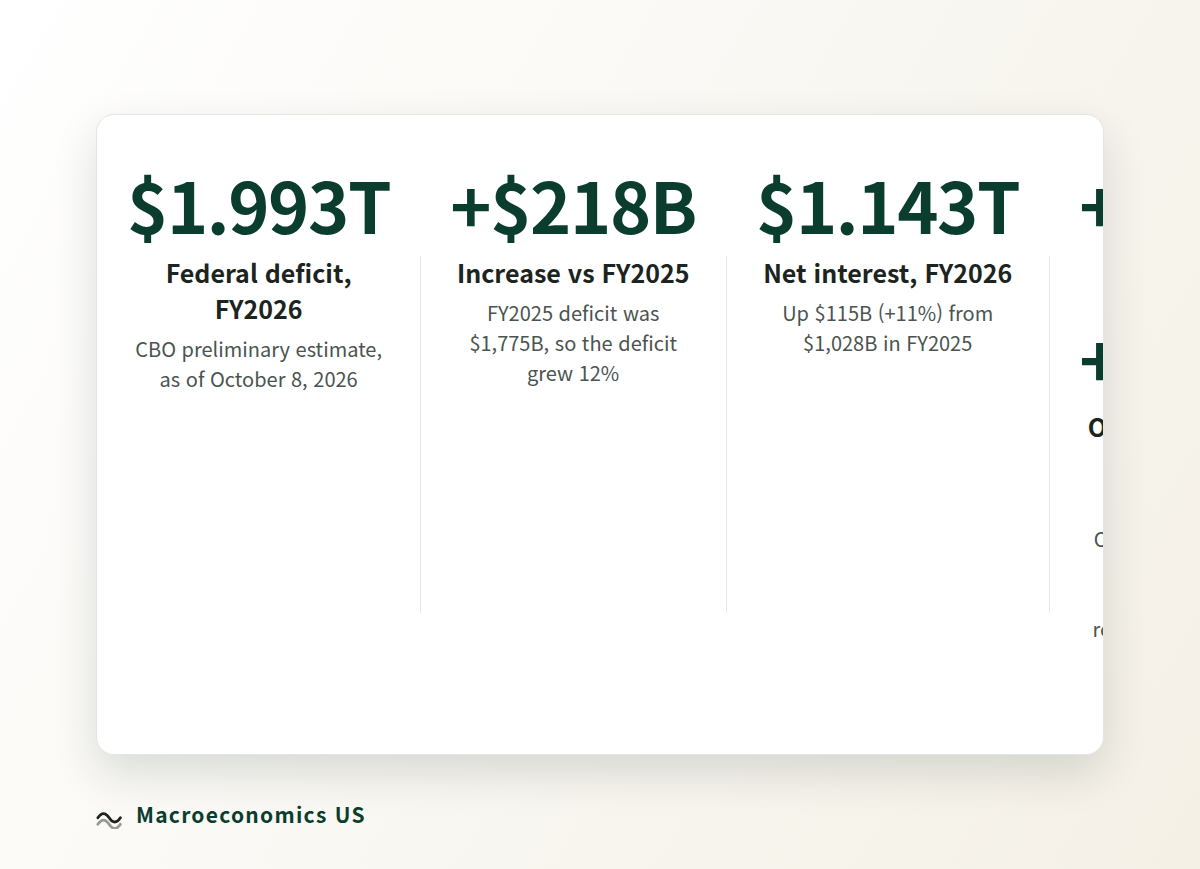
All federal figures in this post come from the Congressional Budget Office's Monthly Budget Review: September 2026, published October 8, 2026 (report page, PDF). They are CBO's preliminary estimates as of October 8, 2026. The Treasury Department's final figures come later, so treat the numbers below as estimates until then. Numbers derived from CBO's figures carry an [ESTIMATE] tag with the formula shown.

| Item | FY2025 | FY2026 |
|---|---|---|
| Receipts | $5,235B | $5,403B |
| Outlays | $7,010B | $7,396B |
| Deficit | −$1,775B | −$1,993B |
Source: CBO, Monthly Budget Review: September 2026, preliminary estimates as of October 8, 2026. The deficit is shown as a negative number. Figures are rounded, so subtracting two values can differ slightly from the change CBO reports.
Start with the dollar math. Outlays (federal spending) of $7,396B minus receipts (federal revenue) of $5,403B leaves the $1,993B deficit. Spending rose $386B while revenue rose $169B, so the gap widened by $218B. The percent math points the same way: outlays grew 6% and receipts grew 3%, and the deficit grew 12% from $1,775B.
On the revenue side, individual income taxes brought in $2,844B (+$188B, +7%) and payroll taxes $1,815B (+$67B, +4%). Corporate income taxes fell to $382B (−$70B, −16%), and customs duties came in at $172B (−$22B, −11%), in a year when about $130B of IEEPA tariff refunds were paid.
One caution on timing. September 2026 alone showed a $28B deficit, while September 2025 showed a $198B surplus, but CBO's text cautions that shifts in payment dates affect that comparison, so a simple year-over-year read of the month is risky. My read: the full-year totals are a better guide than any single month.
Where the extra $218 billion came from
The $218B increase is a net figure: outlays grew faster than receipts. The chart shows the deficit in both years, and the table lists spending lines CBO reports among the largest increases.

The deficit grew $218B (+12%) in one year. Source: Congressional Budget Office, Monthly Budget Review: September 2026 (preliminary estimates, as of October 8, 2026).
| Category | FY2026 | Change vs FY2025 |
|---|---|---|
| Net interest | $1,143B | +$115B |
| Social Security | $1,654B | +$86B |
| Medicare | $1,069B | +$77B |
| Medicaid | $723B | +$55B |
| Defense | $916B | +$48B |
Source: CBO, same report.
- Net interest (+$115B, +11%). This is the government's interest bill. CBO's explanation: the debt grew larger and long-term interest rates were higher, while lower short-term rates partly eased the increase. Think of it as the interest line on a loan statement, which grows when the balance or the rate grows. Net interest also exceeded defense spending: $1,143B − $916B = $227B [ESTIMATE].
- Social Security, Medicare, Medicaid. In percent terms, Social Security rose 5%, Medicare 8%, and Medicaid 8%. Together the three came to $3,446B, up $217B (+7%) from $3,229B.
- Defense. Defense (DoD, military) spending was $916B, up 5% from $868B.
- Education. Spending rose from $35B to $75B (+$41B, +117%). The main driver was a change in estimated student loan costs, not a surge in new spending.
- Veterans Affairs. Spending rose from $377B to $416B (+$39B, +10%).
Do not add these lines to reach $218B. That figure is the gap between outlays growth and receipts growth, and the lines above are only some of the changes inside outlays.
My read: net interest is the line most directly tied to interest rates, which is why it anchors the rest of this post. Social Security, Medicare, and Medicaid together rose more in dollars (+$217B versus +$115B), but they respond to market rates less directly.
The impact chain: from the deficit to your loan payment
My read, in one line: bigger deficit → more Treasury borrowing → pressure on long-term rates → loan pricing → your monthly payment.
Links 1 and 2 start from CBO's preliminary figures as of October 8, 2026. Links 3 and 4 are mechanism and scenario. Mechanism sentences carry a "My read" label, and the arithmetic is rule-of-thumb, not a forecast.
1. A bigger deficit means more borrowing. The deficit was $1,993B, up $218B from FY2025. Spread across 365 days, that is about $5.5B per day [ESTIMATE] ($1,993B ÷ 365). My read: a deficit is financed by selling Treasury securities, so a larger deficit generally means more Treasury issuance.
2. Long-term rates could face upward pressure. Net interest rose $115B to $1,143B, which CBO ties to the larger debt and higher long-term rates. Dollar math: about $3.1B per day [ESTIMATE] ($1,143B ÷ 365). Percent math: about 21% of receipts [ESTIMATE] ($1,143B ÷ $5,403B), or $21 of each $100 [ESTIMATE]. My read: interest cost is roughly debt times the average rate, so either a larger debt or higher rates lifts the bill. Separately, more Treasury supply could push long-term yields higher, all else equal. CBO's statement describes the government's interest cost, not your loan rate.
3. Loan rates can follow market rates. My read: mortgage rates tend to follow long-term Treasury yields more closely than other consumer loans do, while auto loan and credit card rates respond to market rates more loosely, because lenders also price them off shorter-term rates and your credit profile. For link 4, assume two mortgage rates 1 percentage point apart, 6% and 7%, as an illustration. They are not current market rates.
4. The payment lands in your monthly budget. Scenario, not a forecast: on a $400,000 30-year fixed loan, 6% versus 7% changes the payment by $263 a month [ESTIMATE], or $3,156 a year [ESTIMATE]. Percent math: a 1 percentage point gap in the rate. Dollar math: the monthly and yearly amounts above. My read: the scenario applies to you if you are about to take a new loan, refinance, or hold variable-rate debt. It does not apply to the rate on an existing fixed-rate loan. The reader-math section below shows both payments and the formula.
Interpretation and warning. A deficit headline is not a rate quote. My read: the deficit could be one input into long-term rates, and your own loan rate changes when you take a new loan or your existing loan re-prices. Evidence: CBO ties the $115B (+11%) rise in net interest to a larger debt and higher long-term rates, partly eased by lower short-term rates. That is evidence about the government's interest cost. It is not evidence about any specific loan rate.
Reader math: rerun it with your own loan
This is rule-of-thumb, not a forecast. The federal inputs are CBO's preliminary figures as of October 8, 2026. For the loan math, you need three inputs: your loan amount, your quoted rate, and the term.
- Government interest per day: $1,143B ÷ 365 ≈ $3.1B per day [ESTIMATE]. The same method gives the deficit: $1,993B ÷ 365 ≈ $5.5B per day [ESTIMATE].
- Interest share of receipts: $1,143B ÷ $5,403B ≈ 21% [ESTIMATE], or about $21 of each $100 [ESTIMATE].
- Payment formula to reuse: monthly payment = P × r ÷ (1 − (1 + r)−n). P is the loan amount, r is the annual rate ÷ 12, and n is the number of monthly payments (360 for a 30-year loan).
- Example with assumed rates (not current market rates): P = $400,000, 30-year fixed. At 6% (r = 0.06 ÷ 12), the payment is about $2,398 a month [ESTIMATE]. At 7% (r = 0.07 ÷ 12), it is about $2,661 a month [ESTIMATE].
- The difference: $2,661 − $2,398 = $263 a month [ESTIMATE], and $263 × 12 = $3,156 a year [ESTIMATE]. Percent math: the rate moved 1 percentage point. Dollar math: the payment moved $263 a month [ESTIMATE].
- Your turn: put your loan balance in P, your quoted annual rate ÷ 12 in r, and your remaining months in n. Run it at your quoted rate and again at a rate 1 percentage point higher. Subtract the two payments, then multiply by 12 for the yearly difference. A lender's online mortgage calculator should give a similar answer.
- Refinance break-even: total closing costs ÷ monthly payment savings = months to recover the costs. Compare that number with the months you expect to keep the loan.
Refinancers: compare the new payment with the payment on your current statement, then apply item 7. Buyers: run the formula on each lender's quote and compare the monthly totals.
What this does not mean
A deficit headline does not set your loan terms. Five limits keep it in proportion.
- It does not change your fixed-rate mortgage. The interest rate on a fixed-rate mortgage is set in your loan contract, so a federal budget report does not alter it. Think of a fixed rate as a price locked in at signing. Other parts of a housing payment, such as property taxes or insurance, can change for unrelated reasons.
- Fixed and variable behave differently. A variable rate re-prices on the schedule in your loan documents, so market-rate moves could show up there first. Adjustable-rate mortgages, home equity lines, and many credit cards are variable-rate debt, so check your own terms.
- It is not a rate forecast. CBO's report covers budget results. This post uses it as data, not as a prediction of where mortgage rates go, and many other factors also move rates.
- The $1.143 trillion is not a bill to you. Net interest is a federal outlay. It does not appear on your loan statement.
- It is not a reason to rush. One report is one data point. A refinance or a purchase should rest on your own quote, your break-even math, and how long you plan to keep the loan.

Save this checklist: five actions
- Identify each loan rate type. Open your loan documents or lender portal and mark each loan fixed or variable. For each variable loan, write down the balance, the current rate, and the next reset date.
- Calculate your refinance break-even. Break-even months = total closing costs ÷ monthly payment savings. Compare the result with how long you expect to keep the loan.
- Watch the 10-year Treasury yield. Check its trend on any major financial news site whenever you rerun your payment math, so you know which way long-term rates have been moving before you lock a rate.
- Start with variable-rate debt. Sort your variable-rate balances by rate, then rerun the payment math on the largest balance at a rate 1 percentage point higher. That shows which balance would strain your budget first.
- Get at least two quotes for any large loan. Ask each lender for the same loan amount, term, and rate type, with points and fees in writing, then run the payment formula on each quote.
Your next step
Headlines count in trillions, but your decision counts in dollars per month. Before your next lender call, run your loan at your quoted rate and at a rate 1 percentage point higher, and let that gap decide how much the headline matters to you.
Comments
Post a Comment