Headlines Say Housing Is Heating Up — Your Wallet Says Otherwise
If you saw a housing headline this week and felt a flicker of hope, you are not alone. A national price index went up, and up is supposed to be good news. But a headline is not a wallet. Your wallet cares about what a home costs to buy, what it costs to borrow for, and whether anyone is actually buying. Put those three things side by side, using reports released on the same day, and the story changes. Prices are higher than a year ago on paper and lower after inflation. Sales are still running behind last year. Borrowing costs are still high, even after a small weekly dip. That is not a market heating up. That is a market stuck between high prices and high rates, with buyers and sellers both waiting for the other side to blink first.
This post does one simple thing: it lines up the price, sales, and rate reports so you can see them together, instead of one headline at a time. All of the figures below come from the official releases themselves, linked at the end. Where a figure is uncertain, this post says so plainly, because in housing data the uncertainty is part of the story.
Prices: up on paper, down after inflation
Start with the number most likely to make the headline. The S&P Cotality Case-Shiller U.S. National Home Price NSA Index posted a gain of 2.1% for August 2026 compared with a year earlier, up from a gain of 1.9% in July. The national index level stood at 336.74. On a monthly basis, the national index fell 0.2% before seasonal adjustment and rose 0.3% after seasonal adjustment. The difference between those two monthly readings is worth pausing on, because it shows how much the calendar matters in housing. Late summer is normally a slower season for sales, so the unadjusted reading dips while the adjusted reading, which strips out the usual seasonal pattern, rises. Neither reading on its own tells you whether your neighborhood got more expensive last month. Together, they tell you the market did not surge in August; it drifted, with the usual seasonal slowdown doing most of the visible work.
The broader city composites point the same way. The 10-City Composite rose 3.6% from a year earlier, and the 20-City Composite rose 2.7%. Those are real gains, and they are stronger than the national figure, which is one reason the headline version of this report sounds upbeat. But the national figure is the one that matters for the claim that housing as a whole is heating up, and a gain of 2.1% needs a second number next to it before it means anything to a household budget: inflation.
Consumer prices rose 3.4% over the same year. That means home values fell in real terms, after inflation, for a fifteenth consecutive month. Say that slowly, because it reverses the headline in a way that matters for anyone who thinks of a home mainly as a store of wealth. If the price of your house rises 2.1% while the price of everything else rises 3.4%, your house has not kept up with the cost of living. You are not poorer in cash terms, and this is not a crash call. It is a reminder that a nominal gain is not the same as getting ahead. For years now, the typical home has roughly held its purchasing power rather than growing it, and August continued that pattern.
A second price index, from the Federal Housing Finance Agency, tells a consistent story rather than a competing one. The FHFA House Price Index rose 0.3% in August from the previous month on a seasonally adjusted basis, and rose 2.4% from a year earlier. Two different indexes, built from different sets of transactions, landing in the same neighborhood is useful. It means the modest nominal gain is not an artifact of one methodology. It also means neither index supports a story of rapid appreciation. Both describe slow, grinding price growth that trails inflation.
The national average also hides a split that matters more than the average itself. Among the cities in the Case-Shiller release, Chicago posted the strongest annual gain, at 6.7%, followed by New York at 6.2%. Seattle posted the weakest, falling 2.0% from a year earlier. That spread is the whole housing market in miniature. In some cities, tight supply and steady demand are still pushing prices up at a pace that beats inflation. In others, prices are falling outright. A national headline cannot tell you which city you live in, and for a buyer or seller, the city is the market. Before you take any national price claim personally, check what is happening where you actually live, because the gap between the strongest and weakest major markets in this release is wide enough to flip the conclusion.
| Price measure, August 2026 | Reading |
|---|---|
| S&P Cotality Case-Shiller national index, year over year | 2.1% |
| Case-Shiller national index, July 2026 year over year | 1.9% |
| Case-Shiller national index level | 336.74 |
| Case-Shiller national index, month over month, not seasonally adjusted | -0.2% |
| Case-Shiller national index, month over month, seasonally adjusted | 0.3% |
| Case-Shiller 10-City Composite, year over year | 3.6% |
| Case-Shiller 20-City Composite, year over year | 2.7% |
| Consumer price inflation, year over year | 3.4% |
| FHFA House Price Index, month over month, seasonally adjusted | 0.3% |
| FHFA House Price Index, year over year | 2.4% |
| Chicago, year over year | 6.7% |
| New York, year over year | 6.2% |
| Seattle, year over year | -2.0% |
The practical takeaway from the price data is modest, and modesty is the point. If you own a home, August did not make you rich, and it did not wipe you out. It left the typical home slightly behind inflation, with big local differences. If you are shopping, a national gain of 2.1% is not a reason to rush, and it is not a reason to assume prices are about to fall where you live. It is a reason to look at local sale prices for homes like the one you want, because that is the only price that will ever show up in your offer.
Sales: the part the headline skipped
Prices only matter if homes are changing hands. On that test, the same week of reports looks much cooler. Sales of new single-family houses in September 2026 were at a seasonally adjusted annual rate of 676,000, according to estimates released jointly by the U.S. Census Bureau and the Department of Housing and Urban Development. That pace was 0.6% below the August 2026 rate of 680,000, and 5.3% below the September 2025 rate of 714,000. Read the year-over-year comparison carefully, because it is the one that strips out seasonal noise and tells you whether demand is actually stronger than it was. It is not. Fewer new homes sold at that pace than a year earlier, and the gap is not small.
There is an important honesty clause attached to those changes, and it deserves more attention than it usually gets. Both the monthly change and the yearly change carry wide margins of error at the 90% confidence level, and both intervals include zero. The monthly change is 0.6% with a margin of 13.8 percentage points, and the yearly change is 5.3% with a margin of 12.5 percentage points. In plain language, the survey behind these figures is not precise enough to prove that sales fell by those exact amounts. What it does support is a plainer statement: sales have not recovered to last year's level, and the data cannot confirm a precise decline. That distinction matters, because housing commentary too often turns a noisy estimate into a certain verdict. A careful reader should hold both thoughts at once: the best estimate points down from last year, and the statistical fog around it is thick.
The median sales price of a new house in September 2026 was $400,400. That figure sits alongside the sales pace, not apart from it. Builders are still selling homes, and the typical new home still commands a substantial price, but they are selling fewer of them than a year ago at that pace. When volume falls while the median price stays high, it usually means the buyers who remain are the ones who can still make the numbers work at current rates, while others sit out. That is a market narrowing, not broadening.
The existing-home market, which is far larger than the new-home market, tells a similar story with a small monthly bright spot that should not be overread. Existing-home sales increased 1.5% in September from the previous month, but decreased 2.2% from a year earlier, to a seasonally adjusted annual rate of 3.99 million, according to the National Association of Realtors. The monthly rise is real, and it is the kind of figure that can anchor an optimistic headline on its own. The yearly fall is the context that headline leaves out. A market can bounce a little from one month to the next and still be smaller than it was a year ago, and September was exactly that kind of month.
The Realtors' chief economist put the softness in unusually direct terms, saying August and September marked the two slowest months for home sales this year. That sentence does more work than any single percentage in the release. It tells you the monthly uptick in September did not change the character of the year. It also helps explain why sellers are feeling the market differently from the way price headlines suggest. When the two slowest months of the year arrive back to back, buyers gain room to negotiate, listings linger, and asking prices start to look like opening positions rather than final answers.
Existing-home prices, meanwhile, kept edging up. The median existing-home price for all housing types was $417,500 in September, up 1.3% from $412,300 a year earlier. Put that next to the new-home median of $400,400 and a useful contrast appears: in this snapshot, the typical existing home sold for more than the typical new home. That is not a rule of nature, and it can flip with the mix of homes sold in a given month. But it is a warning against assuming new always means pricier, or that any single median describes the home you are looking at. Medians describe the middle of what actually sold, and what sold in September skewed toward buyers who could close at these prices and rates.
| Sales measure, September 2026 | Reading |
|---|---|
| New single-family home sales, seasonally adjusted annual rate | 676,000 |
| New home sales, August 2026 rate | 680,000 |
| New home sales, September 2025 rate | 714,000 |
| New home sales, change from August, with 90% confidence interval | -0.6% (±13.8%) |
| New home sales, change from a year earlier, with 90% confidence interval | -5.3% (±12.5%) |
| Median price, new home | $400,400 |
| Existing-home sales, seasonally adjusted annual rate | 3.99 million |
| Existing-home sales, change from August | 1.5% |
| Existing-home sales, change from a year earlier | -2.2% |
| Median price, existing home | $417,500 |
| Median price, existing home, a year earlier | $412,300 |
| Median price, existing home, change from a year earlier | 1.3% |
Step back and the sales picture is coherent. New-home sales have not regained last year's pace, existing-home sales are down from last year despite a monthly rise, and the year's slowest months just happened back to back. That is not what a heating-up market looks like. It looks like a market where high prices and high borrowing costs have shrunk the pool of people who can buy, and the people left in the pool are taking their time.
Rates: a small dip from a high level
None of the price or sales figures makes sense without the cost of borrowing, because almost nobody buys a home with cash alone. The price sets the size of the loan, and the rate sets the cost of carrying it. This is where the week's news is easiest to misread, because the direction and the level point in opposite directions, and only the level shows up in a monthly payment.
Freddie Mac's Primary Mortgage Market Survey for the week ending October 22, 2026, put the average 30-year fixed-rate mortgage at 7.32%, down from 7.40% the previous week. The average 15-year fixed-rate mortgage was 6.68%. A year earlier, the 30-year average was 6.19%. So yes, rates eased in the latest week, and for buyers who have been watching rates climb, any easing feels like relief. But relief from a high level is not the same as a low level. A buyer comparing this fall with last fall still faces a 30-year rate more than a full percentage point higher in the survey average, on top of home prices that are also higher than a year ago. Both parts of the monthly cost moved the wrong way over the year, even though one of them ticked down in the latest week.
It also matters what kind of average this is. The survey reflects conventional, conforming, fully amortizing purchase loans for borrowers who put a substantial down payment down and have excellent credit, based on applications submitted to Freddie Mac by lenders across the country. Your own quote will differ by credit score, down payment, loan type, points, and the day you lock. Treat 7.32% as a benchmark for the direction of the market, not as a promise of what a lender will offer you. If your quote comes in above the survey average, that does not necessarily mean something went wrong. It may simply mean your loan looks different from the survey's typical loan.
The weekly dip also needs a time warning. One week does not make a trend, and housing decisions made on a single weekly reading tend to age badly. What matters for a buyer is the rate available during the weeks when you are actually shopping and ready to lock, and whether you have room in your budget if rates move back up while you search. A small weekly decline is worth noting, and it is worth exactly that much: a note, not a strategy.
When you combine the three pieces, the wallet story comes into focus. Prices are up modestly in nominal terms and down after inflation. Sales are down from last year on both the new and existing sides. Rates are down slightly on the week and up sharply from a year ago. No single piece of that combination describes a hot market. Together, they describe a market where the cost of buying a home rose on both fronts over the year — price and financing — and demand responded the way demand usually does when costs rise: it cooled.
Inventory and building: more choices, slower building
If sales are soft, the next question is whether buyers at least have more to choose from, and whether builders are adding to that choice. Here the reports split in a way that actually makes sense once you separate homes already for sale from homes not yet built.
On the new-home side, the seasonally adjusted estimate of new houses for sale at the end of September 2026 was 476,000. At the current sales pace, that represents a supply of 8.4 months. Months of supply is a simple idea with a lot packed into it: if no new homes were added and sales continued at the current pace, that is roughly how long it would take to sell what is already for sale. A higher number means buyers have more time and more leverage, because sellers are competing with a larger shelf of alternatives. A lower number means the opposite. By that measure, the new-home shelf is well stocked relative to the pace of sales.
On the existing-home side, total housing inventory reached 1.60 million units in September, representing a 4.8-month supply. The two months-of-supply figures are not directly comparable as if they described the same shelf, because new homes and existing homes are different markets with different sellers, different timelines, and different reasons for listing. But the direction is the same on both sides: there are homes available, and buyers are not being forced to grab the first thing they see in the way they were during the tightest years. That extra breathing room is one of the few genuinely buyer-friendly facts in this batch of reports, and it is worth naming clearly, because it cuts against both panic buying and panic selling.
Building, on the other hand, is slowing. Overall housing starts decreased 5.2% in September to a seasonally adjusted annual rate of 1.22 million units, according to a report from the U.S. Department of Housing and Urban Development and the U.S. Census Bureau, as summarized by the National Association of Home Builders. Within that total, single-family starts were at a seasonally adjusted annual rate of 859,000 units. Starts are a forward-looking signal, not a report on homes you can buy today. A start today becomes a home for sale months from now, so a slowdown in starts today means a thinner pipeline of new supply later, even while current inventory looks ample. Builders are responding to the same math buyers are: high financing costs, high building costs, and soft demand make it harder to justify breaking ground on spec homes that may sit.
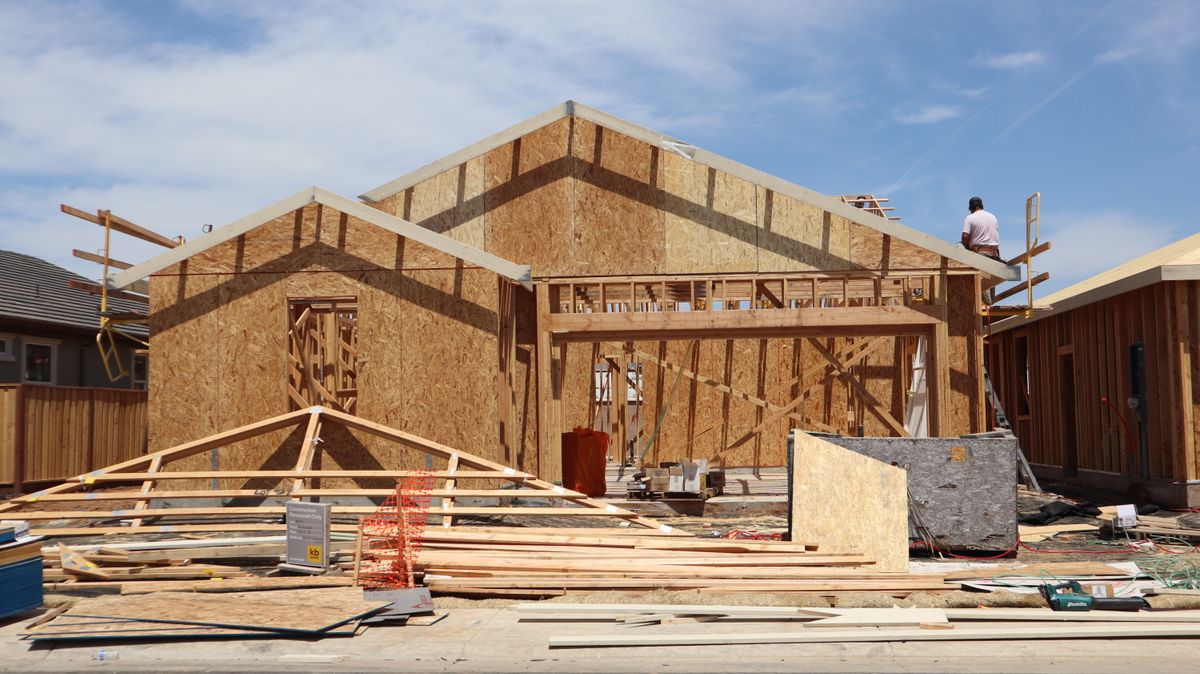
That combination — ample current inventory, slowing future building — is not a contradiction. It is a cycle. When sales slow, inventory piles up. When inventory piles up, builders slow down. When builders slow down, future supply tightens, which can eventually support prices again. But eventually is doing heavy lifting in that sentence. Nothing in these reports says the turn is happening now. They say the pile-up phase is still under way, and the building slowdown is the response to it, not yet the cure for it.
| Inventory and building, September 2026 | Reading |
|---|---|
| New houses for sale, seasonally adjusted | 476,000 |
| New-home months of supply | 8.4 months |
| Existing-home inventory | 1.60 million |
| Existing-home months of supply | 4.8 months |
| Overall housing starts, seasonally adjusted annual rate | 1.22 million |
| Overall housing starts, change from August | -5.2% |
| Single-family housing starts, seasonally adjusted annual rate | 859,000 |
For a buyer, the inventory figures are the most actionable part of the whole batch. More supply relative to sales means you can afford to be picky, to ask for repairs or concessions, and to walk away from a home that does not fit your budget. For a seller, the same figures are a warning against pricing on last year's comps alone. And for anyone waiting, the starts slowdown is a reason to keep watching supply rather than assuming today's choices will still be there in the same quantity later. None of that is a prediction. It is what the current balance of supply and demand implies for negotiating room right now.
If you are buying, selling, or waiting
Reports do not buy houses. People do, with budgets, timelines, and constraints that no national average can capture. The checklist below translates the reports above into questions to ask before you act, grouped by where you stand. None of it is a recommendation to buy or sell now, and none of it replaces advice from a professional who knows your finances and your local market. It is a way to make sure the headline does not make the decision for you.
If you are buying:
- Price the home on the payment, not the sticker. Get a real quote from a lender for your credit profile and down payment, and run your full monthly cost — principal, interest, taxes, insurance, and any association fees — against your actual budget before you fall for a listing. The survey average is a benchmark, not your quote.
- Use the extra inventory. With months of supply at the levels reported above, you have room to compare similar homes, check how long each listing has sat, and ask what the seller is willing to include or adjust. A home that has lingered is information, not just an opportunity.
- Look at local sale prices, not national indexes. Chicago, New York, and Seattle moved in different directions in the same month. Ask your agent for recent closed sales of comparable homes in the same area, and weigh those more heavily than any national figure in this post.
- Keep a rate buffer in your plan. A weekly dip can reverse while you search. Decide in advance the highest payment you can live with comfortably, and do not let a single good week stretch that ceiling.
- Read the new-home numbers with their uncertainty in mind. If a builder or agent cites a precise sales trend for new homes, remember the wide confidence intervals in the Census release. Ask what the local evidence shows, not just the national estimate.
If you are selling:
- Price for the market you are in, not the market you wish you were in. The year's slowest sales months just passed back to back, and buyers have more alternatives than they did during the tightest stretch. An asking price anchored to an older peak can cost you months of carrying costs and, eventually, a larger cut.
- Present the home as the choice it needs to be. With more homes competing for fewer buyers, condition, presentation, and flexibility on timing or included items can matter as much as a small price difference. Ask what comparable listings are offering, not just what they are asking.
- Expect negotiation, and decide your walk-away terms before offers arrive. Knowing in advance what concessions you will and will not accept keeps a slow negotiation from turning into a panicked one.
- Separate your equity story from your sale story. A nominal price gain over the year does not mean your home gained purchasing power, and it does not set what a buyer will pay. The sale price is set by the next buyer, at current rates, in your neighborhood.
If you are waiting:
- Waiting is a position, not a failure to decide, but it has a cost worth naming. While you wait, you keep paying rent or staying put, and the market can move in either direction. Make waiting active: track local inventory, track the rate you would actually be quoted, and set the conditions that would make you act, so you are not simply waiting for a headline to tell you it is time.
- Watch supply, not just prices. The starts slowdown means the future pipeline is thinning even as current inventory looks ample. If local inventory starts shrinking while rates stay high, the negotiating room you have today may narrow. If inventory keeps building, patience may keep paying.
- Do not wait for a single report to settle the question. Price indexes describe the past, sales describe closings and contracts from recent weeks, and rate surveys describe a single week. No one release will hand you a clean buy or sell signal, and anyone who claims otherwise is selling certainty the data does not contain.
How to read the next housing headline
The next housing headline will arrive soon, and it will probably pick one number and make it sound like the whole market. You can protect yourself with a few habits that take less than a minute and save you from most misreadings.
Ask what period the number covers. Price indexes in this batch describe August, sales describe September, and the rate survey describes a week in October. A report released today is not a report about today, and mixing periods together — treating an August price gain as if it described this week's demand — is the most common way a reasonable number becomes a misleading headline.
Ask whether the comparison is monthly or yearly, and whether it is adjusted for seasonality. A monthly dip before seasonal adjustment can coexist with a monthly rise after adjustment, as the Case-Shiller release showed. A monthly rise can coexist with a yearly fall, as existing-home sales showed. The comparison you choose changes the story, so check which one the headline chose and why.
Ask what the number leaves out. A price gain without inflation next to it hides whether homeowners kept up with the cost of living. A sales change without its confidence interval hides whether the survey can even prove the change happened. A rate dip without last year's level hides whether borrowing is actually cheaper than it was. The missing number is often the most important one, and this week's reports are a textbook case: every optimistic reading in them gets quieter once the companion figure is placed beside it.
Ask who the number describes. National figures describe no one's actual neighborhood. City figures in this release ranged from a solid gain to an outright fall. Your market is local, your loan is personal, and your timeline is your own. National data is a starting point for questions, not a substitute for local answers.
- What period does the number actually cover?
- Monthly or yearly - and seasonally adjusted or not?
- What companion number is missing - inflation, the confidence interval, or last year's level?
The bottom line
So, is housing heating up? On the evidence released this week, no — not in the way that matters to a wallet. Prices rose modestly in nominal terms and fell behind inflation. Sales ran behind last year for both new and existing homes. Rates eased a little on the week and remain well above last year's level. Inventory gives buyers more room than they had, and builders are responding to soft demand by starting fewer homes. That is a market in a standoff, not a market on a run.
A standoff is not a disaster, and it is not an opportunity in disguise. It is a market where patience has value, where local facts beat national slogans, and where the most expensive mistake is letting a headline rush you into a decision your budget cannot comfortably carry. If you take one habit from this batch of reports, make it this: never judge housing by one number. Judge it by price, sales, and rates together, with inflation standing next to price and last year standing next to every change. The headline may still win the click. Your wallet gets to win the decision.
Sources
S&P Cotality Case-Shiller Index Reports Annual Gain in August 2026 (PR Newswire, October 27, 2026)
FHFA House Price Index Up in August (FHFA, October 27, 2026)
New Residential Sales Press Release, September 2026 (U.S. Census Bureau and HUD)
Affordability Challenges Push New Home Sales Lower (NAHB, October 27, 2026)
Existing-Home Sales Increased in September, According to NAR Report (NAR, October 13, 2026)
Mortgage Rates Decrease to 7.32% (Freddie Mac release via GlobeNewswire, October 22, 2026)
Single-Family Starts Down as Affordability Challenges Persist (NAHB, October 20, 2026)
Disclosure: This post is general information about housing market data, not personalized financial advice. Home prices, sales, and mortgage rates vary by location, property, and borrower, and the figures cited here are national survey and index estimates subject to revision. Talk to a qualified financial or housing professional about decisions for your own situation.
Comments
Post a Comment