Gas Prices Just Pushed Inflation Higher — What Wednesday’s CPI Really Means for Your Wallet
Your gas station receipt just got a lot longer — and Wednesday's inflation number will show it. But before you panic about the headline, here's what actually matters for your wallet.
The September Consumer Price Index drops Wednesday, October 14 at 8:30 AM ET (BLS). Pantheon Macroeconomics forecasts headline inflation of +0.6% month-over-month — but nearly all of that is gasoline. Strip out the gas station noise, and the real story is far calmer.
What will Wednesday's CPI actually show?
Headline CPI will jump +0.6% for September, driven almost entirely by a ~10% surge in gasoline prices contributing roughly 0.4 percentage points (Pantheon Macroeconomics forecast via TradingView, October 9). That's the number that'll dominate headlines.
But here's the number that matters: core inflation — excluding food and energy — is expected at just +0.2% (Pantheon). The Federal Reserve watches core, not headline, when setting interest rates. A 0.6% headline with 0.2% core tells a very different story than 0.6% across the board.
For context, August CPI came in at +3.4% year-over-year headline and +2.4% core (BLS). September's core holding at +0.2% monthly would keep that disinflation trend intact.
Here's a detail most coverage skips: gasoline carries a weight of about 3.8% in the CPI basket (BLS relative importance, July 2026). That sounds small — until you realize a 10% monthly swing in something with a 3.8% weight moves the entire index by nearly 0.4 points on its own. This is exactly why energy spikes hijack inflation headlines: a small slice of the basket with violent price moves can dominate the number everyone quotes.
Why did gas prices spike so hard?
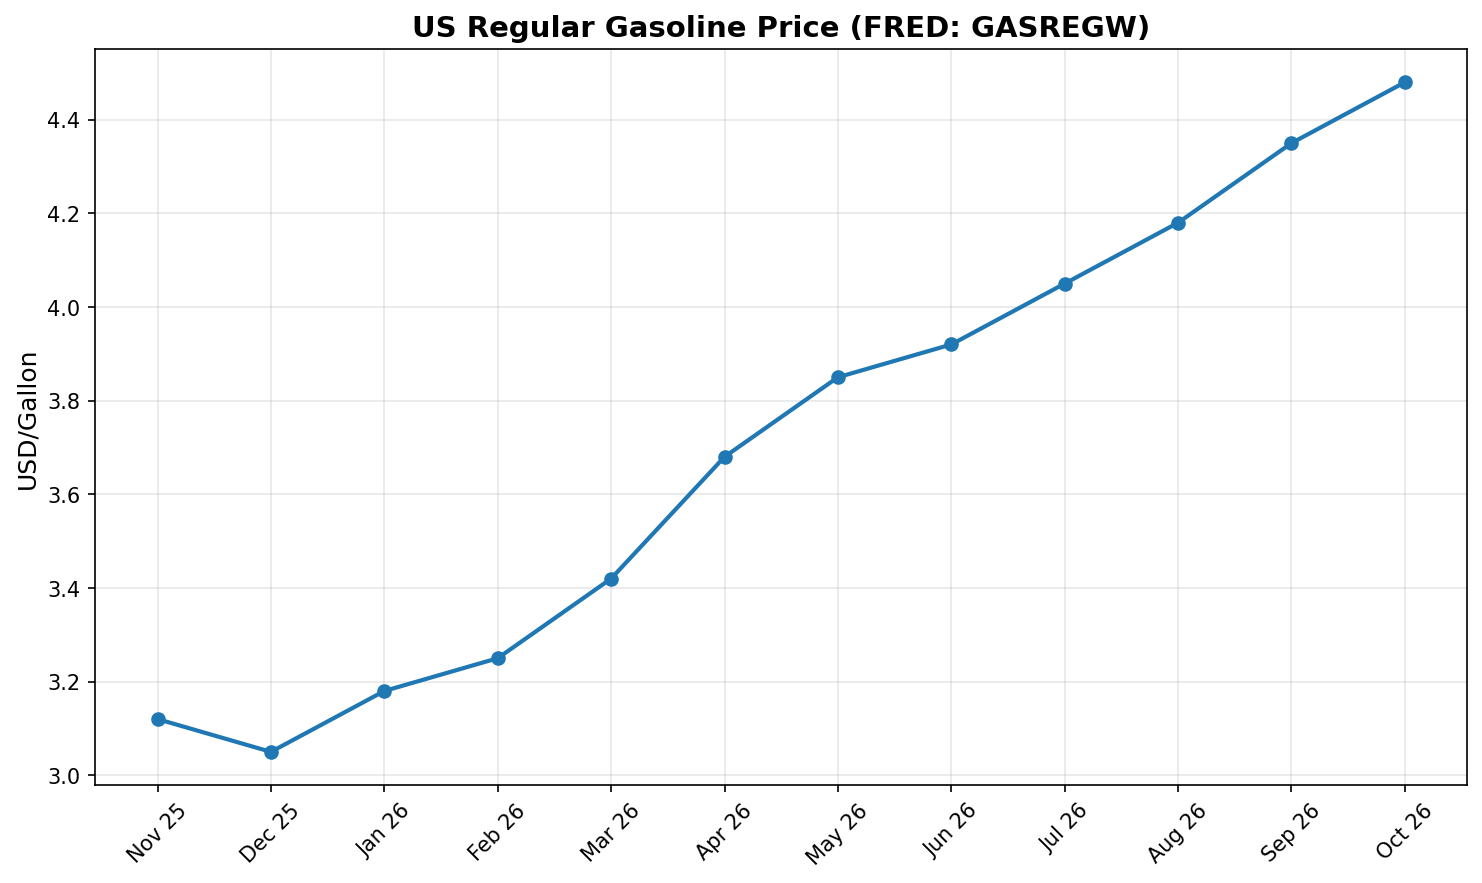
AAA's national average hit ~$4.48 per gallon on September 24 — an all-time high for this time of year (AAA Fuel Prices). That's up from ~$3.16 a year ago, a staggering $1.32 increase.
Recent readings have eased slightly to ~$4.36–$4.37, but remain dramatically elevated. FRED's weekly retail gasoline series (GASREGW) confirms the surge, with the August 17 reading at $4.049 already well above historical norms.
The gasoline spike alone accounts for roughly two-thirds of September's expected headline increase. Without it, we'd be looking at a very ordinary inflation report.
So what actually sets the price you see on the sign? According to the U.S. Energy Information Administration (EIA), every gallon breaks down into four buckets: the price of crude oil (typically the largest share, roughly half), refining costs, taxes, and distribution and marketing. When crude rallies, the pump follows — usually with a lag of a few weeks as wholesale costs work through the supply chain. Refinery outages or maintenance can add a regional premium on top, and state taxes explain why the same gallon costs far more in some states than others.
We've been here before — the 2022 precedent
The last time gasoline hijacked an inflation report this dramatically was June 2022, when AAA's national average hit $5.02 per gallon — still the all-time record (AAA). That spike, driven by the oil shock following Russia's invasion of Ukraine, pushed headline CPI to 9.1% year-over-year, a 40-year high.
What happened next is instructive. Core inflation peaked months later and took far longer to come down — which is precisely why the Fed looks through energy spikes rather than reacting to them. Chasing a gasoline-driven headline with rate hikes would be like steering by the rearview mirror: by the time policy bites, the energy shock has usually already faded.
The parallel isn't perfect — today's $4.48 is well below 2022's $5.02, and the underlying economy looks different. But the mechanics are identical: a concentrated energy shock inflates the headline while the core trend tells the real story. In 2022, investors who panicked at the headline and those who watched core ended up in very different places.
Why your state pays more (or less) than the national average
The $4.48 national average hides enormous regional gaps — prices can differ by more than a dollar per gallon between states (EIA weekly retail data). If you live on the Gulf Coast near the refineries, you're paying far less than someone in California, and the reasons are structural, not accidental.
Three forces drive the gap. First, taxes: state gasoline taxes range from under 10 cents to over 60 cents per gallon, and some states layer on additional fees. Second, refinery proximity: Texas, Louisiana, and Mississippi sit next to the refining complex, so transportation costs are minimal. Third, boutique fuel blends: California requires a special cleaner-burning formulation (CARB gasoline) that fewer refineries produce, creating a persistent premium — especially when any of the state's refineries goes down for maintenance.
There's also a seasonal rhythm most drivers never notice. The EPA requires lower-volatility summer-blend gasoline from June 1 through mid-September, and refineries begin switching production in the spring — a transition that often nudges prices up just as driving season starts. Fall brings the cheaper winter blend back. If your bill felt lighter last winter, that wasn't your imagination.
Headline vs. core: which number should you watch?
Watch core. Always watch core.
Headline inflation includes volatile energy and food prices that swing wildly month to month. Core strips those out to reveal the underlying trend — and that trend is what determines Fed policy, wage negotiations, and ultimately your borrowing costs.
Think of it this way: gasoline is a thunderstorm. Core inflation is the climate. You don't redesign your house because of one storm, and the Fed doesn't set rates based on one gas price spike.
When Wednesday's numbers hit, ignore the screaming headline. Look for the core number. If it's +0.2% as forecast, inflation remains on its slow path down — and that's good news for your wallet.
How to check gas prices yourself (no pundit required)
You don't need to wait for headlines to know what you're paying — the data is public and free. Three bookmarks worth keeping:
1. FRED's weekly retail gasoline series (GASREGW). The Federal Reserve Bank of St. Louis publishes the national average weekly price, updated every Monday: fred.stlouisfed.org/series/GASREGW. This is the same series economists cite — no paywall, no spin.
2. AAA's daily gas price tracker. For national, state, and metro averages updated daily: gasprices.aaa.com. Useful for checking whether your local station is overcharging relative to your metro average.
3. EIA's weekly retail gasoline price. The Energy Information Administration breaks prices down by region and grade every Monday: eia.gov weekly prices. Best for understanding the regional gaps described above.
A practical habit: check your metro average on AAA before a fill-up. If your usual station is 20+ cents above it, drive the extra two blocks. At $4.48 a gallon, a 20-cent spread on a 15-gallon tank is $3 per fill — over $150 a year for weekly drivers.
What does this mean for your wallet right now?
Three actions to take this week:
1. Don't panic about the headline. A 0.6% monthly print sounds alarming, but it's a gas story, not a broad inflation story. Your grocery and housing costs aren't suddenly spiraling. Remember: gasoline is 3.8% of the basket doing the shouting for the other 96%.
2. Cut your gas bill immediately. Use a gas price comparison app, check if your credit card offers gas cashback, and combine trips. At $4.48/gallon, even small savings add up fast. And check that metro-average spread — loyalty to one station is costing you.
3. Check your variable-rate debt before the October FOMC. The Fed meets October 27–28. If core inflation stays tame, rate cut expectations hold. But if you carry credit card balances or variable-rate loans, now's the time to review — don't wait for the Fed to decide for you.
What's next after Wednesday?
The inflation story doesn't end with CPI. Thursday, October 15 at 8:30 AM ET brings September retail sales (consensus +0.3% m/m) and PPI simultaneously. Then all eyes turn to the October 27–28 FOMC meeting.
If core inflation cooperates on Wednesday, the Fed has room to stay patient. If it surprises higher, expect market volatility — and start thinking about locking in rates where you can.
One more date for the calendar-minded: with gasoline doing the heavy lifting in September's report, October's CPI (due mid-November) will face tough year-over-year comparisons against last fall's elevated prices. Base effects could make the next few reports look better than the underlying trend — read them the same way: headline for the noise, core for the signal.
What could surprise on Wednesday?
Forecasts are not guarantees — here's what would change the story.
Upside surprise (hotter than expected): if core comes in above +0.3%, the "it's just gas" narrative cracks. Shelter costs — the largest CPI component at roughly a third of the basket — have been the slowest to cool, and any reacceleration there would force markets to rethink Fed patience. Watch the shelter line in the BLS release as closely as the headline.
Downside surprise (cooler than expected): if gasoline's contribution fades faster than Pantheon's +10% estimate implies, or core prints +0.1%, rate-cut chatter gets louder into the October FOMC. Either way, the framework doesn't change: separate the energy noise from the core signal first, then decide what it means for your money.
Disclosure: This article is for informational purposes only and does not constitute financial advice. Economic forecasts are inherently uncertain. Data sourced from BLS, AAA, Pantheon Macroeconomics, EIA, and FRED as cited.
Comments
Post a Comment