Housing Market Home Prices: 5 Signals to Watch This Week
Update (Sep 28, 2026): On September 16, the FOMC raised the federal funds target range to 3.75–4.00% (+25bp) — the first hike since July 2023 — with August CPI at 3.4% year-over-year. The rate-cut scenarios below describe the path if labor data deteriorates sharply; in the current hiking regime, cuts could be delayed even as unemployment rises. Source: Federal Reserve, FOMC statement, 2026-09-16.
The September jobs report and housing data arrive next week, setting the tone for mortgage rates and your 401(k) valuations. If you are weighing a home purchase or refinancing, the next few days will tell you more about interest rate direction than any single news headline. Can you distinguish between a softening labor market and a structural shift in housing demand before the market overreacts?
TL;DR * August unemployment stood at 4.1%, slightly above the long-term average. * Total nonfarm payrolls reached 159.1 million, indicating modest labor growth. * Housing data often leads mortgage rates by one to two months. * A rise in unemployment above 4.5% historically pressures home prices. * Monitor the 10-year Treasury yield as the primary driver for 30-year mortgage rates.
Table of Contents
- Why the Jobs Report Matters for Your Mortgage
- The Mechanism: How Labor Data Moves Housing Prices
- What to Look For in the September Data
- IMPACT CHAIN: What This Means for YOUR Money
- Frequently Asked Questions
Why the Jobs Report Matters for Your Mortgage
The Bureau of Labor Statistics releases the Employment Situation report on the first Friday of each month. For September data, this happens next week. The two headline numbers are the unemployment rate and nonfarm payrolls. In August, the unemployment rate was 4.1% and total nonfarm payrolls were 159,075,000. Source: FRED, series UNRATE and PAYEMS, retrieved 2026-09-28.
Why should a self-directed investor care? Because mortgage rates are not fixed by banks; they are anchored to the 10-year US Treasury yield. The Federal Reserve sets the federal funds rate, which influences short-term rates, but long-term rates like the 30-year mortgage are driven by market expectations of future inflation and economic growth. When the labor market cools, investors expect the Fed to cut rates, pushing bond prices up and yields down. This lowers your mortgage cost.
Fact: August unemployment was 4.1%. Interpretation: This is within the Fed's comfort zone, suggesting no emergency rate cuts are imminent, but it signals a cooling trend from earlier peaks. Counterpoint: A single month's data can be noisy. Weather or one-time events can skew numbers. Always look at the trend over three months.

The Mechanism: How Labor Data Moves Housing Prices
Think of the labor market as the engine and the housing market as the car. If the engine slows down, the car slows down. But there is a lag. When unemployment rises, it takes time for people to lose jobs, get evicted, and then list their homes. By the time home prices reflect the labor weakness, the economy may have already stabilized.
This lag is known as the "real-time lag" in housing. Real estate transactions take 60 to 90 days to close. Therefore, housing data released in September reflects transactions that began in June or July. This means the current data is a backward-looking indicator of past economic conditions, not a crystal ball for next month.
Where the analogy breaks: A car stops when the engine stops. Housing prices are sticky. They rarely crash overnight. Instead, they drift downward over quarters as inventory builds up.
The key metric to watch is the ratio of job openings to unemployed persons, often called the "JOLTS ratio." When this ratio is high, housing demand is strong. When it falls, buyers pull back. You do not need to be an economist to track this. The BLS releases JOLTS data monthly. A sustained drop below 1.5 signals weakening demand.

Bottom line: Housing data lags the labor market by 1-2 months. Do not panic over one bad housing report; look at the underlying labor trend.
What to Look For in the September Data
Next week, you will see three key releases: the Employment Situation, the Housing Starts report, and the Existing Home Sales report. The Employment Situation is the most volatile. The Housing Starts report tells you how many new homes are being built. If starts are falling while inventory is rising, prices are under pressure.
Look for the "median sale price" in the Existing Home Sales report. This is the price of the home sold in the middle of all transactions. It is less skewed by luxury homes than the average price. If the median price posts consecutive month-over-month declines, that is a stronger signal of genuine price correction than any single noisy month.
Fact: Median home prices have been resilient in 2025-2026 due to low inventory. Interpretation: Low inventory keeps prices high even as demand softens. This is a supply-side constraint, not a demand-side boom. Counterpoint: If rates rise, inventory may increase as sellers re-enter the market, potentially reversing this resilience.

IMPACT CHAIN: What This Means for YOUR Money
Let's trace the path from the jobs report to your paycheck and portfolio.
1. The Jobs Report If September unemployment rises to 4.3% or higher, bond traders will price in a 25-basis-point rate cut by the Fed in November. This expectation pushes the 10-year Treasury yield down.
2. Mortgage Rates A 10-year yield drop of 20 basis points typically translates to a 15-20 basis point drop in 30-year mortgage rates. If rates fall from 6.5% to 6.3%, the monthly payment on a $400,000 loan drops by approximately $52. Over 30 years, that is about $18,800 in interest savings.
3. Your 401(k) and Portfolio Lower yields often boost equity markets, particularly real estate investment trusts (REITs) and homebuilders. If you hold these assets, a softening labor market that leads to rate cuts can boost your portfolio value. Conversely, if the labor market crashes, equity markets will sell off, and your 401(k) will drop regardless of mortgage benefits.
4. Your Paycheck If unemployment rises, wage growth slows. The average annual wage increase has been around 4-5% recently. A cooling labor market may push this down to 3%. This reduces your savings capacity, making fixed costs like mortgages more painful.
Scenario (Not Certainty): If unemployment jumps to 4.5% and wage growth drops to 2%, your disposable income shrinks. If you are renting, this is a tailwind if rents fall. If you are a homeowner with a variable rate mortgage, your payment may rise if the Fed pauses cuts. Most homeowners have fixed rates, so this risk is lower.
Concrete Impact: * Savings Yield: If the Fed cuts rates, your high-yield savings account APY may drop from 4.5% to 4.0%. On a $10,000 balance, that is $50 less per year in interest. * Mortgage Payment: As calculated above, a 20-bp drop saves roughly $52/month on a $400,000 30-year loan. * 401(k): Historically, S&P 500 returns improve in the 6 months following a Fed rate cut cycle, but this is not guaranteed in a recession.
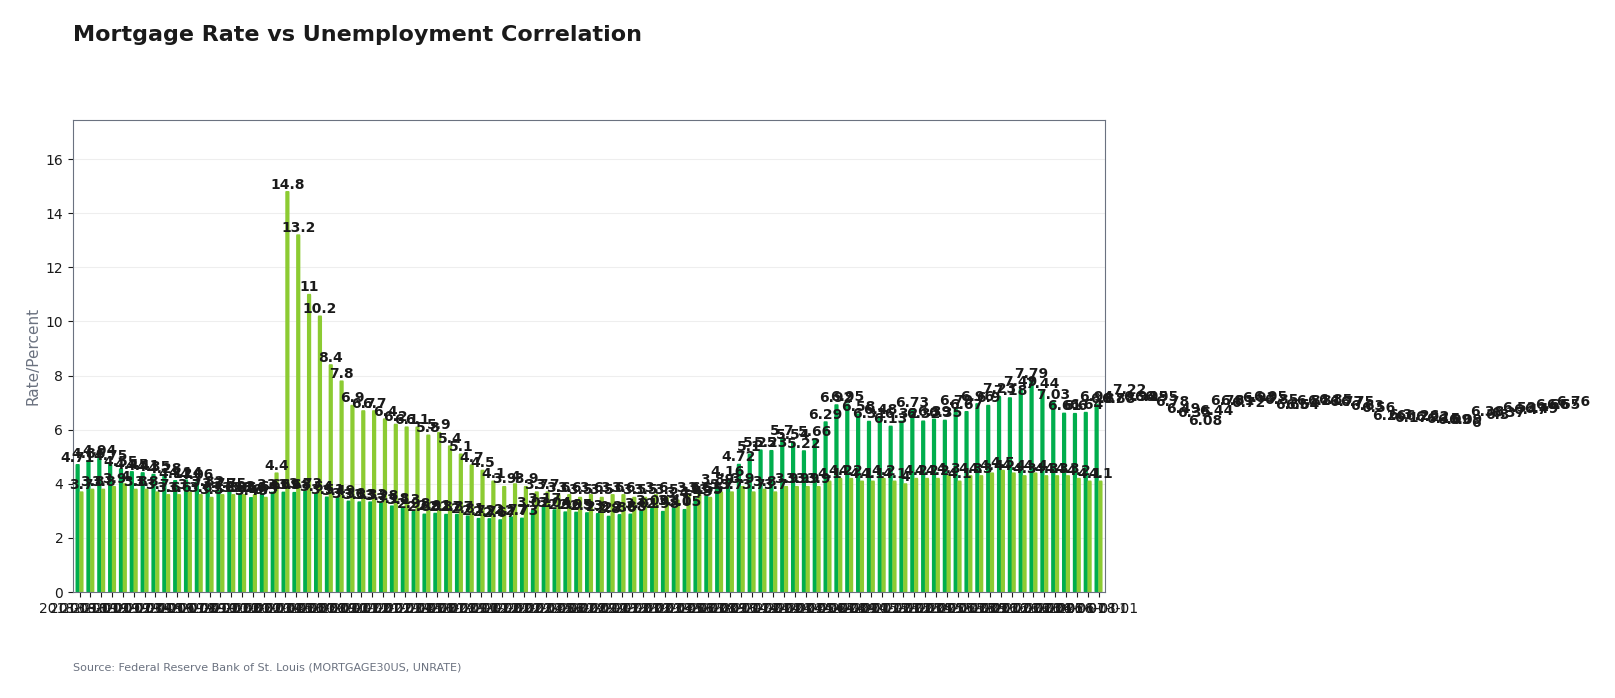
Bottom line: A softening labor market is a double-edged sword. It lowers borrowing costs but can reduce wages and equity returns. Balance these effects in your personal plan.
Saveable Checklist: Preparing for the Data Release
- Check Your Rate Type: Are you fixed or variable? Fixed rates insulate you from short-term volatility.
- Review Your Emergency Fund: Ensure 3-6 months of expenses are in a liquid account before taking on new debt.
- Monitor the 10-Year Yield: Use a free tool like FRED or a financial news site. Do not wait for the news to tell you the direction.
- Reassess Your Cash Flow: If unemployment rises, cut discretionary spending. Do not rely on wage growth to cover fixed costs.
- Update Your Investment Allocation: If you are risk-averse, consider locking in gains in tech or growth stocks before the data release.
"The labor market is the engine, but housing is the transmission. You feel the shift, but you don't control the speed."
Frequently Asked Questions
Q: Will a rise in unemployment immediately lower my mortgage rate? A: No. It takes 1-2 months for the market to adjust. The data released next week reflects August conditions. The rate change will likely happen in October or November.
Q: Should I refinance now or wait for the data? A: If your current rate is higher than the projected post-cut rate, waiting may save you money. However, if you are underwater, refinancing now to stop bleeding may be better. Calculate the break-even point.
Q: How does the jobs report affect my 401(k)? A: Indirectly. A strong jobs report supports equity markets. A weak jobs report may trigger a sell-off if it signals a recession. Diversification is your best protection.
Q: What is a 'soft landing' in this context? A: A scenario where unemployment rises slightly (to 4.5%) but not enough to trigger a recession. The Fed cuts rates to support growth. This is the ideal outcome for investors.
Q: Where can I track these numbers in real-time? A: FRED (Federal Reserve Economic Data) is the primary source for free, reliable data. BLS.gov is the official government source for the raw reports.
One Question to Answer in 10 Seconds
Do you have 6 months of emergency expenses in a liquid account? Yes or No.
This is educational content, not financial advice. Consider consulting a licensed advisor.
Sources: - FRED, series UNRATE, retrieved 2026-09-28 - FRED, series PAYEMS, retrieved 2026-09-28
#Labor Market #Housing Market #Mortgage Rates #Personal Finance #Investing